Market Status, Incentives, Technology Comparison, and Economic Benefits
1. Introduction
India has emerged as one of the world’s fastest-growing solar photovoltaic (PV) markets due to rising electricity demand, falling solar equipment prices, and strong policy support. Solar PV technology converts sunlight into electricity using semiconductor materials and is widely used for utility-scale solar plants, rooftop solar systems, and off-grid applications.
India’s solar capacity has expanded rapidly over the past decade—from 2.8 GW in 2014 to over 100 GW by 2025, representing more than 3,400% growth. Solar power now contributes nearly 47% of India’s total renewable energy capacity.
As of 2025–2026:
- Total installed solar PV capacity exceeds 90–105 GW
- India added 36.6 GW in 2025 alone, a 43% increase from 2024.
Solar power plays a key role in achieving India’s goal of 500 GW renewable energy capacity by 2030.
2. Components of a Solar Photovoltaic System
A typical solar PV system consists of:
| Component | Function |
| Solar Panels (Modules) | Convert sunlight into DC electricity |
| Solar Inverter | Converts DC power into AC power |
| Mounting Structure | Supports panels on roof or ground |
| Batteries (optional) | Energy storage |
| Net Meter | Allows export of surplus electricity |
| Monitoring System | Tracks generation and performance |
3. Current Status of Solar Installations in India
Solar Capacity Distribution
| Category | Installed Capacity | Share |
| Utility-scale ground mounted | ~81 GW | ~77% |
| Rooftop solar | ~17 GW | ~16% |
| Hybrid solar systems | ~2.8 GW | ~3% |
| Off-grid solar | ~4.7 GW | ~4% |
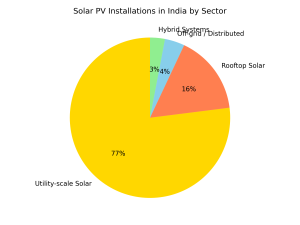
Solar power has become the largest contributor to renewable energy growth in India.
Rooftop Solar Growth
- Total rooftop capacity: ~20.8 GW by 2025
- Residential sector contribution: 76%
- Industrial & commercial sector: 18%
- Government buildings: ~1%
State Leaders in Solar Installations
Top states include:
- Rajasthan
- Gujarat
- Maharashtra
- Tamil Nadu
- Karnataka
These states lead due to high solar irradiance, supportive policies, and large land availability.
4. Sector-wise Solar Adoption in India
| Sector | Key Drivers | Share of Installations |
| Residential | Subsidies, net metering | ~76% of rooftop |
| Commercial | High electricity tariffs | ~5–6% |
| Industrial | Energy cost reduction | ~18–20% |
| Utility-scale | Government solar parks | Majority of capacity |
5. Government Subsidies and Incentives
India has introduced several schemes to accelerate solar adoption.
Major National Solar Schemes
1. PM Surya Ghar: Muft Bijli Yojana
-
- Launched: 2024
-
- Target: 1 crore rooftop solar homes
-
- Subsidy up to ₹78,000 for 1–3 kW systems
-
- Free electricity up to 300 units per month
2. PM-KUSUM Scheme
Supports solar pumps and feeder-level solar plants for agriculture.
3. Production Linked Incentive (PLI)
Encourages domestic solar manufacturing.
Subsidy Structure (Residential Rooftop)
| System Size | Subsidy |
| Up to 2 kW | ₹30,000 per kW |
| 2–3 kW | Additional subsidy up to ₹18,000 |
| Total | Up to ₹78,000 |
Commercial and industrial sectors typically do not receive direct subsidies but benefit through:
-
- Accelerated depreciation (up to 40%)
-
- Net metering
-
- Open access solar
-
- Renewable energy certificates (REC)
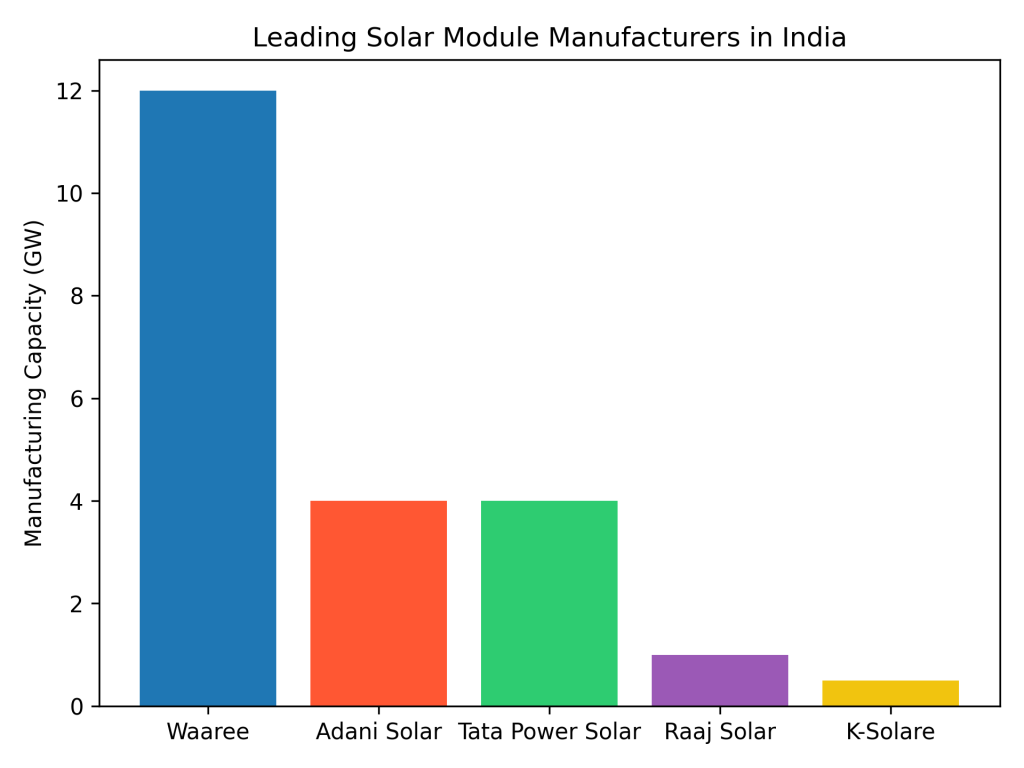
6. Comparison of Leading Solar Panel Brands in India
| Brand | Manufacturing Capacity | Efficiency Range | Key Technology |
| Adani Solar | ~4–5 GW | 20–22% | Mono-PERC, TOPCon |
| Waaree Energies | ~12 GW | 20–22% | Mono-PERC, bifacial |
| Raaj Solar | ~1 GW | 19–21% | Mono-PERC |
| K-Solare | ~500 MW | 18–20% | Poly & mono modules |
| Tata Power Solar | ~4 GW | 19–21% | Mono-PERC |
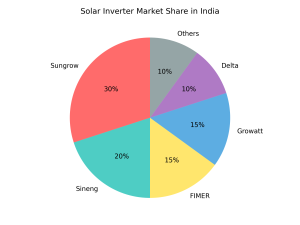
7. Comparison of Leading Solar Inverter Brands in India
| Brand | Type | Efficiency | Key Segment |
| Sungrow | Central/String | ~98.8% | Utility & C&I |
| Growatt | String | ~98.4% | Residential |
| FIMER | String/Central | ~98% | Industrial |
| Delta | String | ~98% | Commercial |
| Waaree Inverters | String | ~97–98% | Rooftop |
8. Solar Power vs Grid Electricity Cost
Electricity tariffs vary across states.
| State | Industrial Tariff (₹/kWh) | Solar LCOE (₹/kWh) |
| Maharashtra | 8 – 10 | 3 – 4 |
| Gujarat | 7 – 9 | 3 – 4 |
| Rajasthan | 6 – 8 | 2.5 – 3.5 |
| Karnataka | 7 – 9 | 3 – 4 |
| Tamil Nadu | 8 – 10 | 3 – 4 |
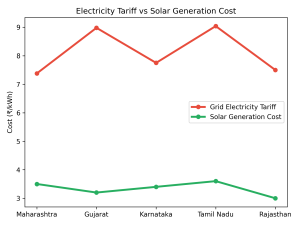
Result:
Solar energy can reduce electricity costs by 40–70% for commercial and industrial consumers.
9. Economic Benefits of Solar Power Systems
Financial Benefits
-
- Lower electricity bills
-
- Protection from tariff inflation
-
- Payback period: 3–6 years
-
- System life: 25 years
Environmental Benefits
-
- Zero emissions
-
- Reduced carbon footprint
-
- Supports national climate goals
Energy Security
-
- Reduces grid dependency
-
- Enables decentralized power generation
10. Case Study Example: 100 kW Rooftop Solar System
| Parameter | Value |
| Installation cost | ₹45–50 lakh |
| Annual generation | ~150,000 units |
| Electricity savings | ₹10–12 lakh/year |
| Payback period | ~4 years |
| Lifetime savings | ₹2–3 crore |
11. Future Outlook of Solar Power in India
India is expected to:
-
- Reach 250 GW solar capacity by 2030
-
- Continue rapid rooftop adoption
-
- Expand domestic solar manufacturing
-
- Integrate battery storage and hybrid systems
The solar sector will play a critical role in India’s transition toward clean, affordable, and reliable energy.
12. Conclusion
Solar photovoltaic systems are becoming the most economical and sustainable electricity solution in India. With strong policy support, declining technology costs, and increasing electricity tariffs, solar power adoption across residential, commercial, and industrial sectors is expected to grow exponentially in the coming decade.